The article contains detailed information about the server monitoring offered by Server Surgeon as part of the Professional Server Management service.
The monitoring service uses only open source software and various scripts written by us in cases where custom monitoring is required. The main component of the monitoring is the open source project called Nagios Core. It is highly configurable, has advanced features and a very reach collection of plugins that makes it a powerful monitoring tool.
Access to the Nagios Core monitoring web interface is provided to all our customers where you can see the status of the server and its monitored services. Various actions are available as well such as scheduling downtime, tactical overview, status map, advanced reporting and many others. The monitoring web interface is SSL enabled to ensure full encryption. Several examples of the monitoring web interface can be seen in the below screenshots.
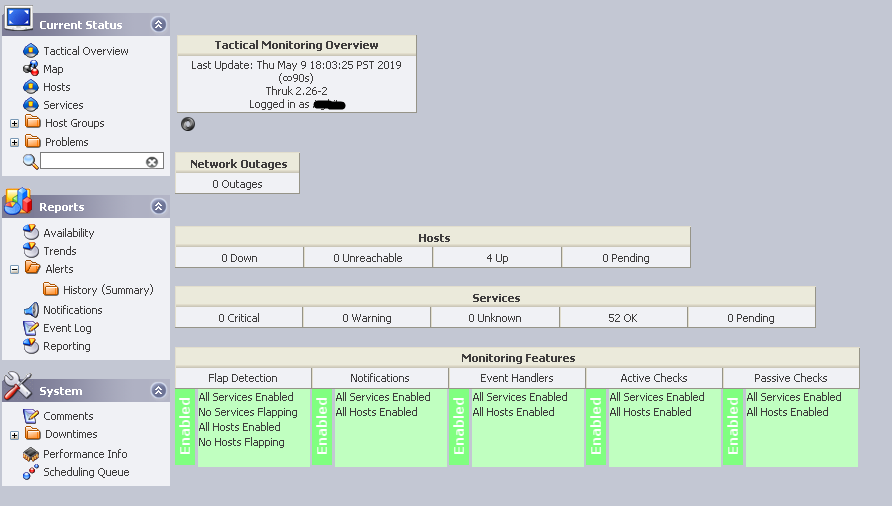
Tactical Overview
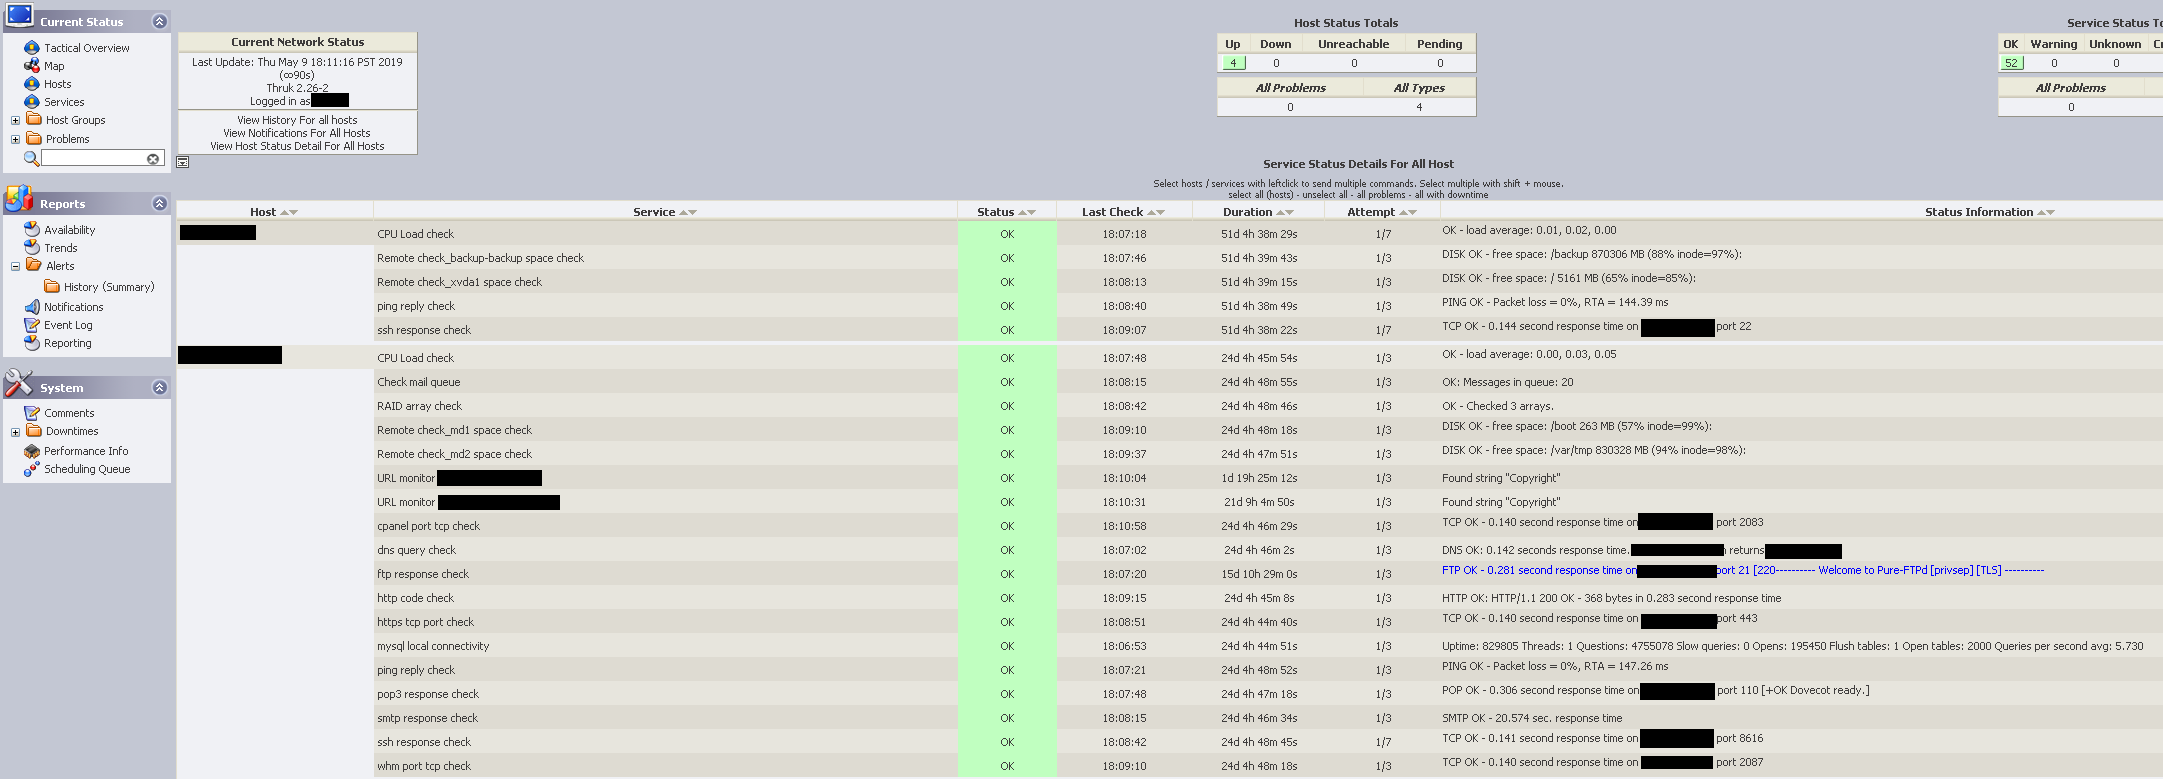
Services overview
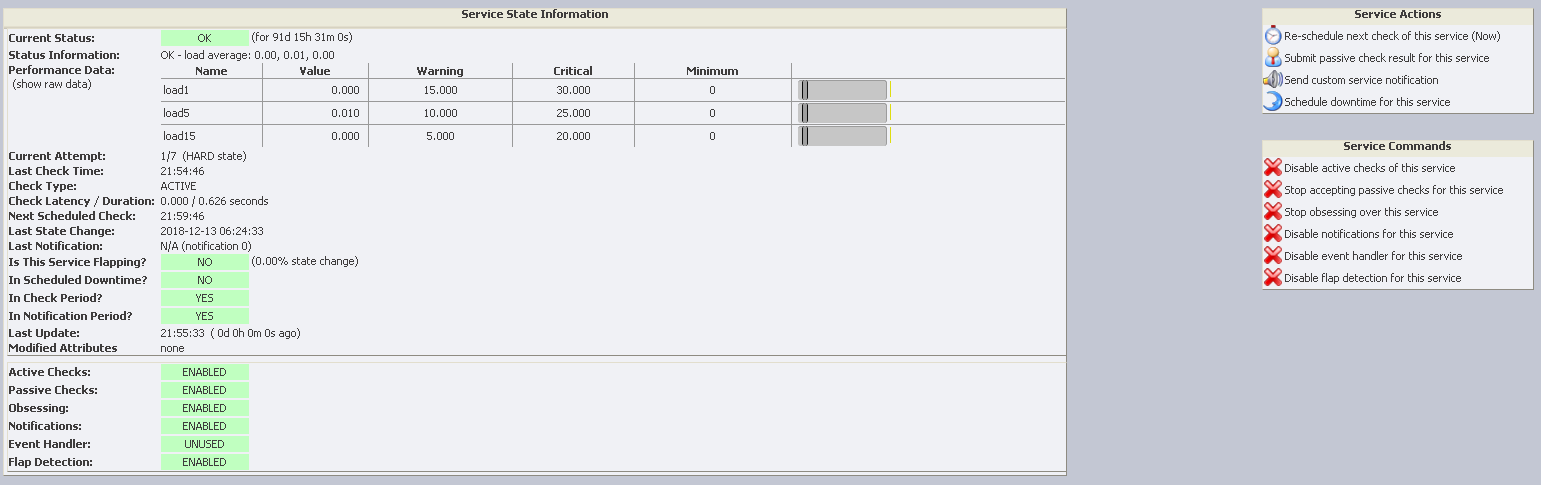
Service details and available commands
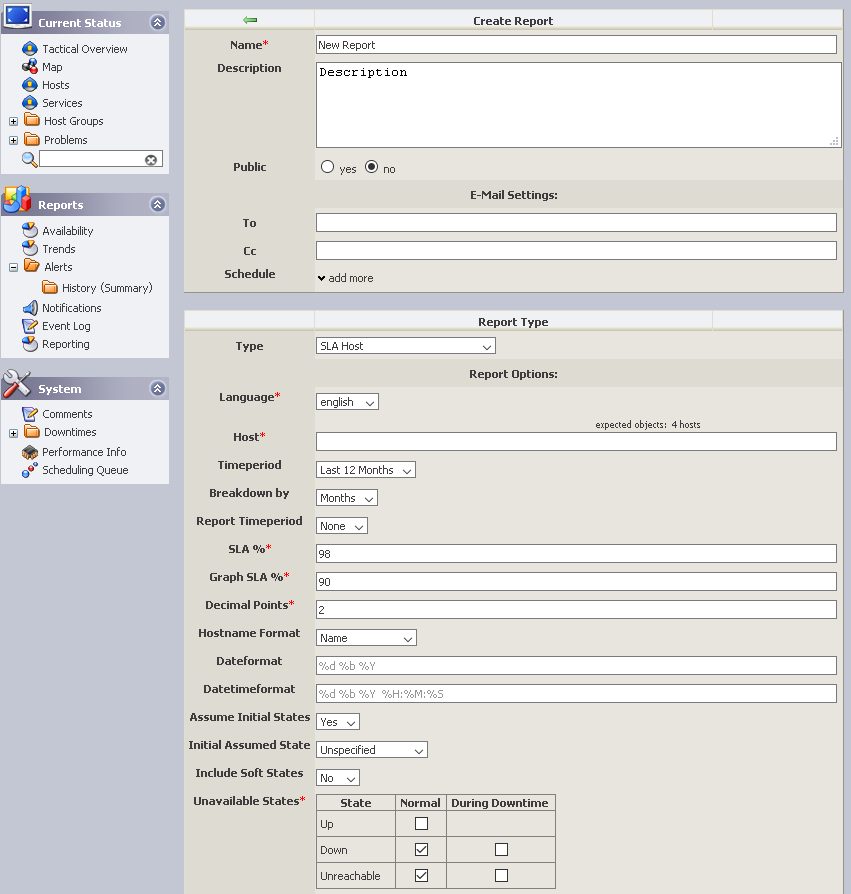
Creating reports
To perform the actual checks Nagios uses a collection of plugins a list of which can be found here. Most of them are remote checks where our monitoring server will connect to the client server and perform the necessary operations.
For server resource related checks like CPU load, memory, RAID array status, disk space usage, etc the NRPE Nagios extension is used which runs on the remote customer server and performs the checks locally. Nagios will then connect to the NRPE daemon and retrieve the necessary check results. In cases where access to the NRPE daemon is restricted for security reasons the NRDP extension is used instead where all the remote service checks are scheduled to run as cron jobs and the check results are instead sent to our monitoring server.
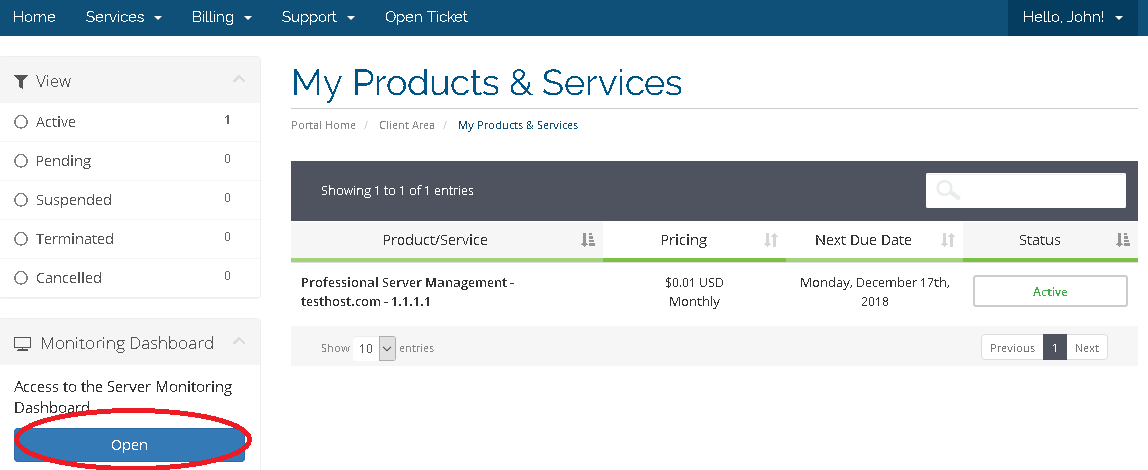
And finally the monitoring dashboard described above can be accessed from our client area as shown below.